Documentation.
This documentation describes the core features of FocusTrade terminal. We will update the content as new features get implemented.
Getting Started.
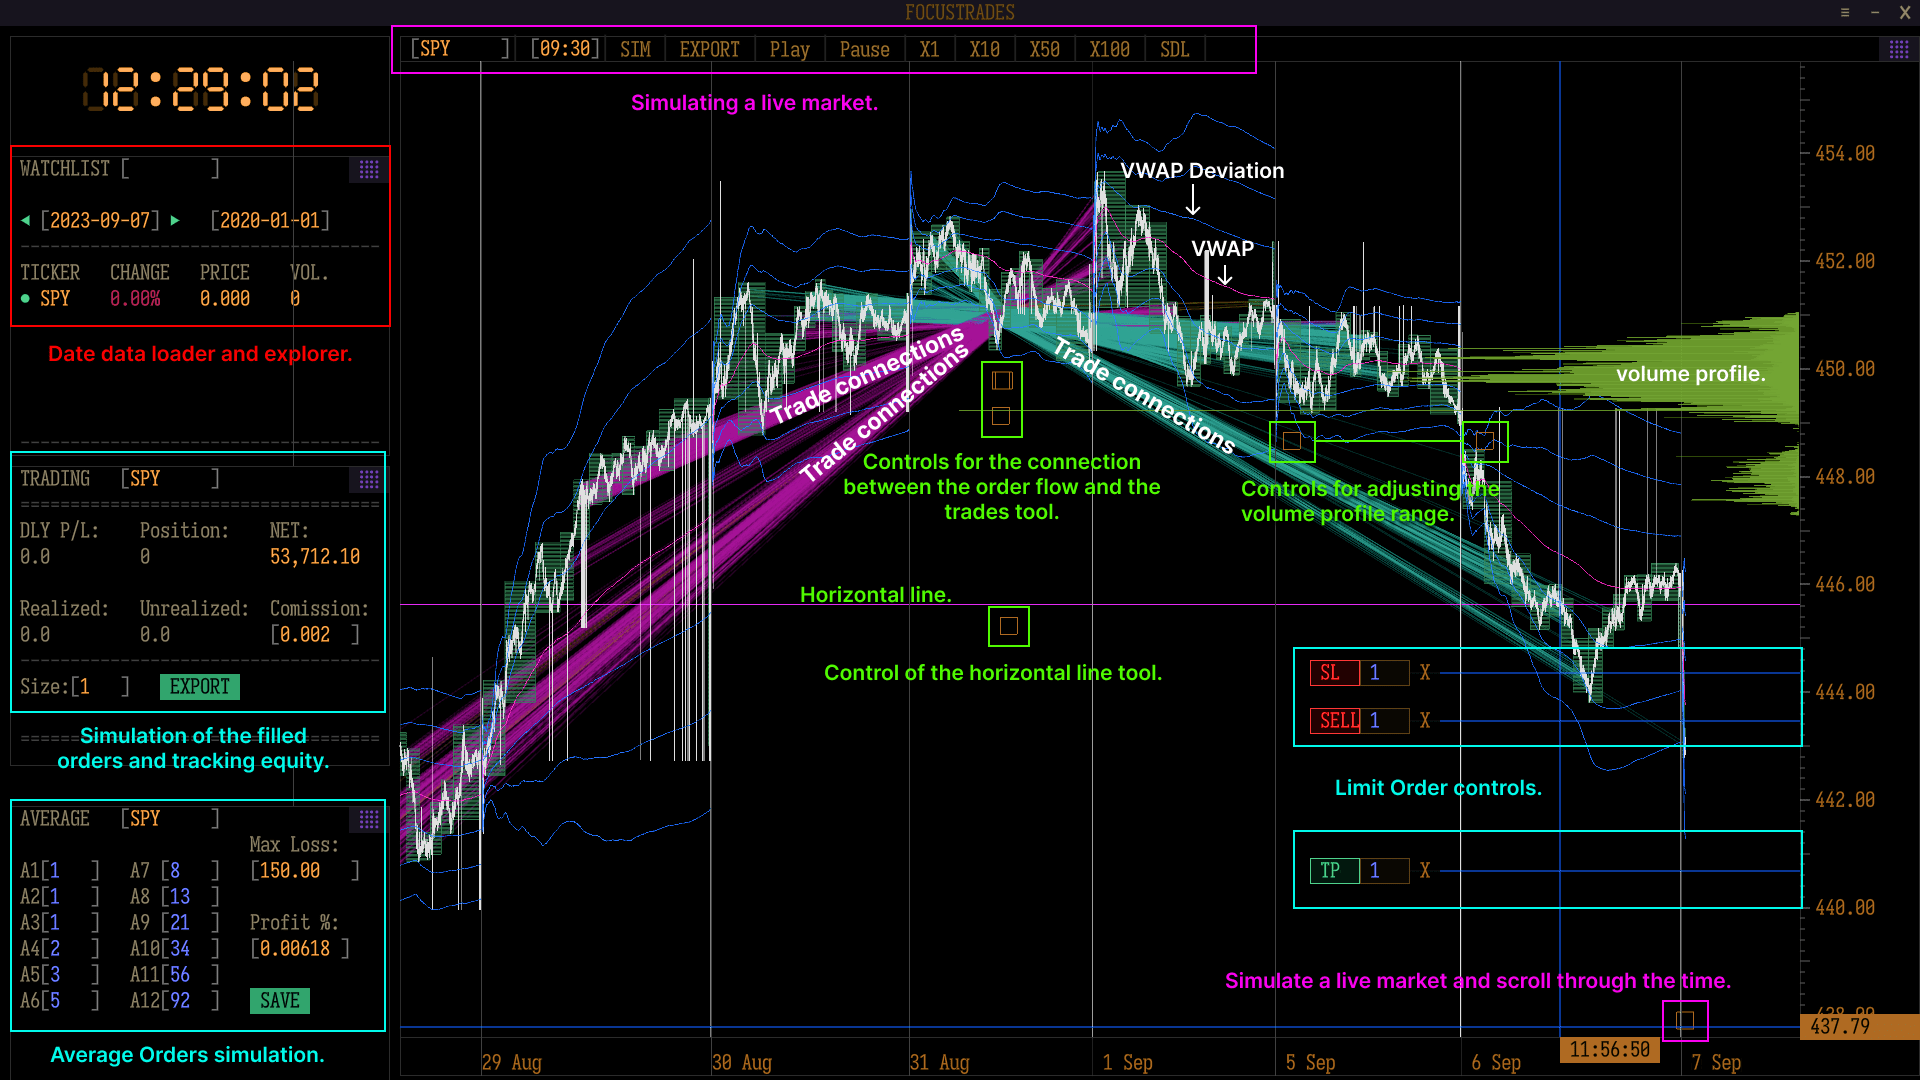
Infographics show the main features and controls.

Keyboard Shortcuts.
To use any tool, press a key and select a range or place a point on the chart.
Trades connection: "D"
Volume Profile: "V"
Balance zone: "B"
Horizontal line: "H"
Open limit order: "Ctrl + right click"
To remove any tool from chart: "right click on yellow rectangle".
Instruments that you can load in FocusTrade.
On the free demo version of the FocusTrade terminal, there is only 3 months of S&P 500 index data. Equities and other instruments are not available.
The premium version of the terminal can load historical S&P 500 data.
For equities and other instruments, custom options are available. Please contact us for more information.
Visual representation connection between trades.
What is the connection between trades? It's essentially an exchange between traders that is depicted on a chart, showing the connection from the point where someone buys to the point where they sell.
Dynamic volume profile.
A dynamic scrolling representation of volume within a particular time range.
Balance zones.
This easy-to-use tool creates duplicates of the consolidations that you select.
Data date explorer.
With this tool, you can select a date from which the historical data will start loading onto the chart, allowing you to explore the chart or backtest your strategy.
Strategy Backtesting.
With this tool, you can emulate a time and sales tape, making it the same as a real-time market data feed and order flow.
Horizontals lines.
Simple horizontal line.